What Is Prometheus?
Prometheus is an open-source monitoring and alerting toolkit originally developed by SoundCloud. It collects metrics from configured targets at specified intervals, evaluates rule expressions, displays results, and can trigger alerts if certain conditions are met.
- Time-series database optimized for metrics
- Pull-based data collection via HTTP
- PromQL: A powerful query language
- Alertmanager for notifications
What Is Grafana?
Grafana is an open-source analytics and visualization platform. It connects to various data sources—including Prometheus—and transforms raw metrics into insightful dashboards.
- Customizable dashboards
- Supports multiple data sources
- Alerting and annotations
- Plugin ecosystem for extended functionality
Together, Prometheus and Grafana provide a complete observability solution: Prometheus collects and stores metrics, while Grafana visualizes them.
Prometheus Architecture
Prometheus follows a pull-based model:
- Targets expose metrics via /metrics endpoints.
- Prometheus Server scrapes these endpoints at regular intervals.
- Time-series data is stored locally.
- Alertmanager handles alerting rules and notifications.
- Exporters (e.g., Node Exporter, Blackbox Exporter) expose metrics from various systems.
Grafana Architecture
Grafana is data-source agnostic:
- Connects to Prometheus, InfluxDB, Elasticsearch, CloudWatch, and more.
- Uses panels to visualize data in dashboards.
- Supports templating, annotations, and alerting.
- Can be deployed locally or via Grafana Cloud.
Grafana doesn’t store data—it queries external sources like Prometheus in real time.
Advantages
Prometheus
- Lightweight and easy to deploy
- No external dependencies
- Powerful querying with PromQL
- Excellent for time-series metrics
- Active community and CNCF support
Grafana
- Stunning visualizations
- Supports over 50 data sources
- Easy dashboard creation and sharing
- Alerting and annotations
- Extensible via plugins
Disadvantages
Prometheus
- Limited long-term storage (unless integrated with remote storage)
- No native dashboarding (requires Grafana)
- Not ideal for logs or traces
- Push model requires workaround for short-lived jobs
Grafana
- No native data collection
- Requires external data sources
- Complex dashboards can be resource-intensive
- Alerting setup can be tricky for beginners
UseCases
Use Case | Prometheus Role | Grafana Role |
| Kubernetes Monitoring | Scrapes metrics from kube-state-metrics, cAdvisor | Visualizes pod health, resource usage |
| Application Performance | Collects HTTP request metrics | Displays latency, error rates |
| Infrastructure Monitoring | Uses Node Exporter for system metrics | Shows CPU, memory, disk usage |
| IoT Analytics | Scrapes device metrics | Visualizes sensor data trends |
| Business Metrics | Custom instrumentation | Dashboards for KPIs and SLAs |
Best Practices
- Use labels wisely in Prometheus to organize metrics.
- Keep scrape intervals balanced—too frequent can overload, too sparse can miss anomalies.
- In Grafana, use templating to create reusable dashboards.
- Set up alerting rules in Prometheus and route them via Alertmanager.
- Use annotations in Grafana to mark deployments or incidents
Visualizing the Prometheus-Grafana Architecture
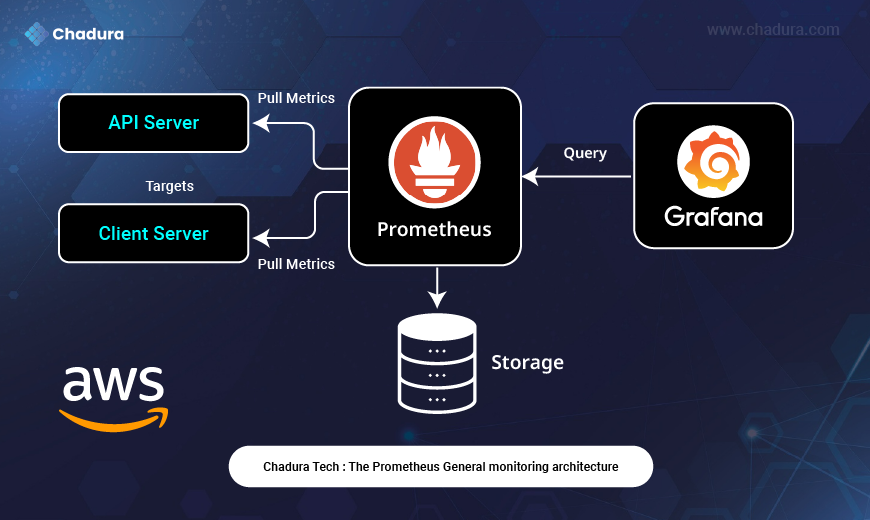
The diagram you uploaded beautifully illustrates the flow of data and interaction between components in a typical monitoring stack. Here's how each part fits into the system:
Targets: API Server & Client Server
These are the applications or services you want to monitor. Each exposes a /metrics endpoint that Prometheus can scrape.
- API Server: Might expose metrics like request latency, error rates, or throughput.
- Client Server: Could provide system-level metrics like CPU usage, memory, or disk I/O.
Both are labeled as targets, meaning Prometheus is configured to pull metrics from them at regular intervals.
Prometheus: The Monitoring Core
Prometheus sits at the center of the diagram and acts as the metrics collector.
- It uses a pull-based model, reaching out to each target to scrape metrics.
- These metrics are stored in Prometheus’s time-series database, shown as the downward arrow to the Storage component.
- Prometheus also exposes an API that allows Grafana to query the stored metrics.
Storage: Time-Series Database
This component represents Prometheus’s internal storage engine.
- It stores metrics with timestamps and labels.
- Prometheus retains data for a configurable duration (e.g., 15 days), unless extended via remote storage integrations.
Grafana: The Visualization Layer
Grafana connects to Prometheus via its query API.
- It sends queries to Prometheus to retrieve metrics.
- These metrics are then visualized in dashboards—graphs, gauges, tables, etc.
- Grafana doesn’t store data itself; it simply visualizes what Prometheus provides.
Data Flow Summary
Here’s the full cycle as shown in the image:
Targets (API & Client Servers) expose metrics ==> Prometheus pulls metrics from these targets ==> Prometheus stores the metrics in its time-series database ==> Grafana queries Prometheus to retrieve metrics ==> Grafana displays the data in interactive dashboards.
Why This Architecture Works Well
- Decoupled Design: Prometheus handles collection and storage; Grafana handles visualization.
- Scalability: You can add more targets or dashboards without disrupting the system.
- Flexibility: Grafana can query multiple Prometheus instances or other data sources.
- Observability: This setup gives you deep insight into both application and infrastructure performance.
The Prometheus monitoring architecture and how it works with other components
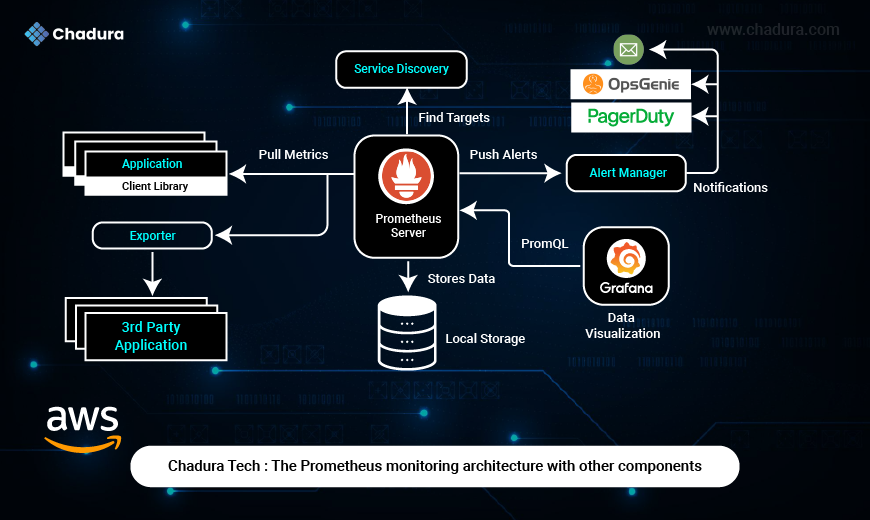
Applications and Metrics Collection
- Application (Client Library) : Your applications are instrumented with a Prometheus client library, which exposes metrics (e.g., CPU usage, request count, error rates) in a format Prometheus can scrape.
- 3rd Party Application + Exporter : For software that doesn’t natively support Prometheus (e.g., MySQL, Redis, Node Exporter), an Exporter is used to collect metrics and expose them in Prometheus format.
Prometheus pulls metrics from these endpoints.
Prometheus Server
- Core Component: The Prometheus server periodically scrapes metrics from applications and exporters.
- Service Discovery: It automatically finds what targets to scrape (e.g., EC2 instances, Kubernetes pods) using AWS, Kubernetes, or other integrations.
- Local Storage: All collected metrics are stored in Prometheus’s time-series database.
- PromQL: Prometheus Query Language is used to filter, aggregate, and process metrics.
Alerting System
Alertmanager:
- Prometheus pushes alerts to Alertmanager when certain conditions are met (e.g., CPU usage > 90% for 5 minutes).
- Alertmanager handles notification routing, deduplication, and silencing.
- It sends alerts to channels like Email, OpsGenie, and PagerDuty.
Data Visualization
- Grafana:
- Connects to Prometheus using PromQL queries.
- Displays metrics in beautiful dashboards and graphs.
- Useful for real-time monitoring and historical trend analysis.
Workflow Summary
Applications/Exporters expose metrics ==> Prometheus discovers targets and pulls metrics ==> Data is stored locally and can be queried with PromQL ==> Grafana visualizes the data for analysis==> Alertmanager sends notifications when metrics breach set thresholds.
Conclusion
Prometheus and Grafana are not just tools—they're a philosophy of observability-first engineering. Prometheus excels at collecting and storing metrics, while Grafana turns those metrics into actionable insights. Together, they empower teams to monitor systems proactively, troubleshoot effectively, and scale confidently.
Whether you're running a single EC2 instance or orchestrating thousands of containers, this duo is your best ally in maintaining system health and performance.