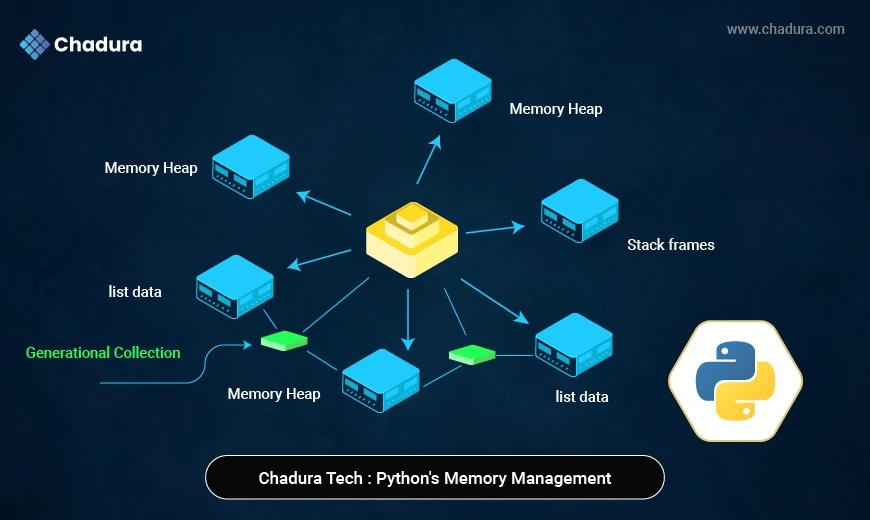
At Chadura Tech, we build scalable and high-performance applications where memory efficiency is just as critical as speed. Whether it’s a Django API, AI inference service, or data pipeline, understanding how Python manages memory helps us keep systems lean, stable, and cost-efficient.
Python automates most memory operations, but behind the scenes, it uses a sophisticated system based on reference counting and garbage collection (GC). Knowing how these mechanisms work allows our engineers to avoid leaks, reduce fragmentation, and fine-tune application performance.
1. How Python Handles Memory
Every Python object includes:
- Type information
- Reference count (how many variables refer to it)
- Value or data block
Python uses reference counting to track when objects are no longer needed. When the count reaches zero, the memory is automatically freed.
Example:
x = "Chadura"
y = x
del y  # reference count decreases
1. Step 1 — Creating the String Object
x = "Chadura"- When Python executes this line, it creates a string object in memory with the value "Chadura".
- Python stores that string somewhere in memory (say, at address 0x1000).
- Then, the variable x is bound (i.e., references) to that object.
x ───▶ "Chadura" (object in memory)The reference count of "Chadura" is now 1 — because one variable (x) refers to it.
2. Step 2 — Assigning a New Reference
y = xNow y is assigned the same object that x points to
So now both x and y point to the same string in memory — not a copy.
x ───▶
"Chadura"
y ───▶
The reference count increases to 2, because there are now two active references (x and y) pointing to the same object.
3. Step 3 — Deleting a Reference
del yThe del statement removes the variable name y from the current namespace.
That means:
- y no longer exists.
- The object "Chadura" loses one reference (from y).
Now the situation looks like this:
x ───▶ "Chadura"The reference count decreases back to 1, because only x still refers to the object.
Step 4 — Automatic Memory Cleanup
If later we also remove x:
del xNow, no variable refers to "Chadura".
Its reference count becomes 0.
When that happens, Python’s memory manager automatically deallocates the object — freeing up that memory space for reuse.
Why This Matters
This simple mechanism is the foundation of Python’s memory management:
- Every Python object has an internal counter (ob_refcnt in CPython).
- When that counter drops to zero, the object’s memory is automatically freed.
- You rarely need to manage memory manually — but understanding this helps prevent leaks and performance issues.
2. The Role of Garbage Collection
Reference counting alone can’t clean up circular references, where objects refer to each other.
That’s where Python’s garbage collector (GC) comes in — it identifies and removes unreachable cyclic objects.
import gc
gc.collect()  # triggers garbage collection
In our production systems, Chadura Tech engineers adjust GC thresholds and timing depending on workload type:
- High-frequency APIs: run GC more aggressively to avoid buildup.
- Data-heavy workloads: delay GC to minimize overhead.
3. Generational Garbage Collection
Python organizes objects into three generations:
- Generation 0: short-lived objects
- Generation 1: medium-lived
- Generation 2: long-lived (like global variables)
Objects that survive collections are “promoted” to older generations.
At Chadura Tech, we fine-tune these generations to minimize memory spikes and improve response stability under heavy traffic.
4. Detecting and Preventing Memory Leaks
Even with automatic GC, memory leaks occur when references are held unintentionally — for example, in caches or long-lived lists.
We use tools like:
- tracemalloc → tracks memory snapshots
- memory_profiler → monitors real-time memory usage
- gc.DEBUG_LEAK → detects uncollected objects
import tracemalloc
tracemalloc.start()
# run workload
print(tracemalloc.get_traced_memory())
These insights help our engineers eliminate leaks before deployment.
5. Best Practices at Chadura Tech
To ensure efficient memory usage, we follow key engineering patterns:
a. Use Generators for Large Data
def data_stream(source):
    for line in open(source):
            yield line
Generators keep memory usage minimal — perfect for data pipelines.
b. Limit Object Overhead
Classes using __slots__ reduce memory footprint:
class Record:
__slots__ = ('id', 'name', 'email')c. Control Object Lifetimes
Explicitly deleting variables or clearing caches in worker processes keeps memory stable.
d. Optimize Django and API Servers
Recycling Gunicorn workers, caching querysets wisely, and using async views reduce long-term memory pressure.
6. Monitoring and Profiling in Production
Chadura Tech integrates memory tracking with Prometheus and Grafana dashboards to visualize:
- Active object counts
- GC cycles
- Worker memory growth
We also set Docker memory limits and recycle processes periodically, ensuring that Python services never exceed allocated resources — critical in cloud environments.
7. Memory Management in AI and Data Systems
AI workloads often demand large tensor and dataset management.
Our engineers apply:
- torch.cuda.empty_cache() to free GPU memory
- numpy.memmap for streaming large datasets
- Custom caching and batching to avoid redundant copies
These optimizations keep AI models efficient and production-ready, whether on AWS SageMaker or on-prem GPUs.
8. Chadura Tech’s Memory Optimization Philosophy
Python’s dynamic design simplifies coding — but understanding its memory model allows us to build systems that are both fast and sustainable.
At Chadura Tech, our engineers:
- Profile before scaling
- Tune GC per workload
- Automate leak detection in CI/CD pipelines
- Optimize object usage and data flow
This disciplined approach ensures smooth performance, reduced infrastructure cost, and reliable uptime.
Conclusion
Memory management isn’t just a technical detail — it’s a foundation of software reliability.
By mastering Python’s reference counting, garbage collection, and profiling tools, Chadura Tech delivers systems that handle growth gracefully and perform efficiently under load.
At Chadura Tech, every byte counts — because efficiency scales performance.


