As cloud adoption accelerates across industries, observability has become one of the most critical pillars of maintaining system performance, security, reliability, and operational excellence. Whether it's microservices running on Kubernetes, virtual machines on the cloud, database engines, or serverless workloads—every engineering team requires robust tools for logging, monitoring, and alerting.
Two of the biggest players in this space are Google Cloud Logging (formerly Stackdriver Logging) and AWS CloudWatch. While both services provide centralized logging and monitoring, each takes a different architectural and operational approach. Organizations migrating between clouds—or operating multi-cloud environments—often struggle to understand how these two platforms compare in terms of features, pricing, integrations, automation, and long-term scalability.
What is Google Cloud Logging?
Google Cloud Logging is a fully managed, real-time logging service that collects log data from Google Cloud resources, applications, Kubernetes clusters, and on-prem systems. It provides:
- Centralized log ingestion
- Real-time log routing
- Log-based metrics
- Insights dashboards
- Retention management
- Integration with BigQuery, Pub/Sub, and Cloud Monitoring
Google Cloud Logging stores logs in a proprietary LogEntry format within a highly scalable, distributed system built on top of BigTable and Google’s internal Colossus storage layer.
Key Characteristics:
- Extremely fast ingest and querying
- Seamless integration with GCP services
- High scalability (petabyte scale)
- Unified logging & monitoring experience
1.2 What is AWS CloudWatch?
AWS CloudWatch is Amazon’s observability platform for:
- Logs
- Metrics
- Events
- Alarms
- Application performance monitoring (via CloudWatch Application Insights)
- Container monitoring (EKS, ECS)
CloudWatch Logs capture application and infrastructure logs, while CloudWatch Metrics handle numerical metrics like CPU, latency, errors, and throughput. CloudWatch Events & EventBridge automate operational tasks through event-driven architectures.
Key Characteristics:
- Deep integration with AWS services
- Strong ecosystem around metrics + alarms
- Supports ingestion from external sources
Excellent for centralized AWS operations monitoring
2. Architecture Comparison
Google Cloud Logging Architecture
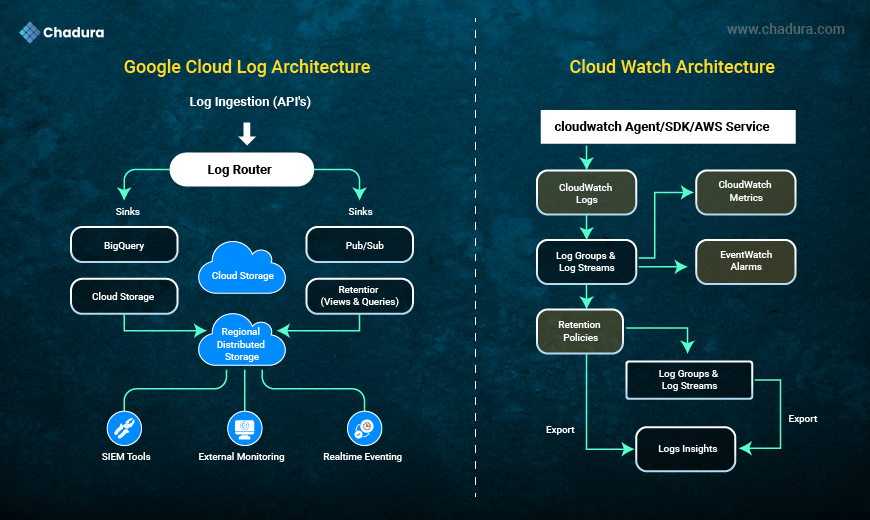
Google Cloud Logging uses a unified, streamlined pipeline where logs are ingested from services like GKE, Compute Engine, Cloud Functions, and load balancers.A central Log Router directs logs to destinations such as BigQuery, Pub/Sub, or Cloud Storage based on user-defined sinks. Logs are stored durably and accessed through Logs Explorer, with easy export and integration support for SIEM tools and real-time monitoring systems.
2.1 Google Cloud Logging Architecture
Google Cloud Logging follows a streamlined pipeline:
- Log Ingestion: Data is collected from GKE, Compute Engine, Cloud Functions, load balancers, and APIs.
- Log Router: Routes logs based on user-defined sinks (BigQuery, Pub/Sub, Cloud Storage).
- Storage: Logs stored in regional distributed storage with high durability.
- Views and Queries: Accessible through Logs Explorer (SQL-like filtering).
- Export & Integrations: Supports SIEM tools, external monitoring stacks, and real-time eventing.
2.2 AWS CloudWatch Architecture
AWS CloudWatch uses a modular architecture with separate components for logs, metrics, alarms, and events.
Logs flow from agents or AWS services into CloudWatch Logs, organized into log groups and streams, where retention policies apply.
You can query logs using Logs Insights, trigger alarms, and route events through EventBridge for automated workflows and integrations.
AWS CloudWatch splits functionality into:
- CloudWatch Logs: For raw logs
- CloudWatch Metrics: For metrics data
- CloudWatch Alarms: For threshold monitoring
- EventBridge: For event routing
- Logs Insights: For querying logs
- Log Groups/Streams: For structuring logs
Key Difference (Architecture)
- Google Cloud Logging uses a single unified logging system, while CloudWatch is a modular observability platform with separate components.
- Google Cloud offers easier routing and export, while AWS provides more granular control but also more complexity.
3. Logging Capabilities (Head-to-Head)
Google Cloud Logging provides a unified logging system with seamless routing, real-time querying, and integrated exports.
AWS CloudWatch offers granular control with separate services for logs, metrics, alarms, and events, enabling flexible but more complex observability.
3.1 Log Ingestion
Google Cloud Logging
- Automatic ingestion from almost all GCP services
- Kubernetes-native logging (GKE integrates directly)
- Supports external ingestion via API
- Very high throughput
AWS CloudWatch
- Automatically collects logs from AWS services
- Requires CloudWatch Agent for EC2
- Supports container logging via Fluent Bit
- Throughput depends on regional service quotas
3.2 Log Querying & Exploration
Google Logs Explorer
- SQL-like syntax
- Fast, index-optimized search
- Advanced filters
- Timeline view
- Real-time streaming
CloudWatch Logs Insights
- Query syntax similar to SQL
- Good performance on structured logs
- Powerful aggregations
Comparison:
Google is faster for large-scale real-time search.
AWS is powerful for metrics extraction and visualization.
3.3 Log Routing and Exporting
Google Cloud:
Google Cloud Logging uses a centralized Log Router that makes exporting easy by routing logs to BigQuery, Pub/Sub, or Cloud Storage through user-defined sinks with minimal configuration.
AWS CloudWatch:
AWS CloudWatch routes logs through Log Groups and Subscriptions, allowing export to services like S3, Lambda, Kinesis, or Elasticsearch, offering more flexibility but requiring additional setup.
Google Cloud Logging
Export destinations:
- BigQuery
- Cloud Storage
- Pub/Sub
- External APIs via Pub/Sub Push
Routing is extremely easy with Log Sinks.
AWS CloudWatch
Export destinations:
- S3
- Lambda
- Kinesis
- ElasticSearch (OpenSearch)
Requires subscription filters and more complex setup.
5. Alerting and Notifications
Google cloud
Google Cloud uses Cloud Monitoring Alerting to trigger alerts based on log-based metrics, sending notifications through email, SMS, Pub/Sub, or third-party tools.
AWS
AWS CloudWatch provides Alarms that monitor metrics and logs, sending notifications via SNS, email, SMS, Lambda, or automated remediation workflows.
Kubernetes Observability (GKE vs EKS)
Google Kubernetes Engine (GKE) offers built-in, seamless observability with native Cloud Logging and Cloud Monitoring, providing automatic metrics, logs, and workload insights without extra setup.
Amazon EKS requires more configuration, often involving CloudWatch Container Insights, Fluent Bit, or third-party tools, giving flexibility but adding complexity to achieve full observability.
GKE + Google Cloud Logging
- Native integration
- No agent required
- Automatic container log parsing
- Built-in dashboards
EKS + CloudWatch
- Requires CloudWatch Agent + Fluent Bit
- Manual configuration
- Good dashboards but requires more setup
6. Pricing Comparison
Google Cloud Logging billing is based on log ingestion volume, storage, and any exports, with a generous free usage tier and simplified pricing.
AWS CloudWatch charges separately for log ingestion, storage, metric retrievals, and custom metrics, often resulting in more granular but potentially higher costs depending on usage patterns.
Pricing structures differ significantly.
6.1 Google Cloud Logging Pricing
Pricing based on:
- Ingestion tier
- Storage
- Log routing
- Log-based metrics
- Export destinations
GCP gives 50 GB/month free logs.
6.2 AWS CloudWatch Pricing
Charges for:
- Logs ingestion
- Logs storage
- Logs Insights queries
- Metrics
- Dashboards
- Alarms
- Custom metrics
- Anomaly detection
CloudWatch pricing is known to be more expensive when adding metrics + logs + alarms.
7. Multi-Cloud and Hybrid Support
Google Cloud Logging supports hybrid and multi-cloud setups through Anthos, Log Router exports, and integrations with SIEM or external monitoring tools.
AWS CloudWatch also provides hybrid support via CloudWatch Agent, AWS Outposts, and integrations with on-prem systems, but often requires more manual configuration for multi-cloud environments.
Google Cloud Logging
Supports ingestion from:
- AWS
- Azure
- On-prem systems
- Kubernetes anywhere
AWS CloudWatch
Primarily AWS-focused.
8. Security & Compliance
Google Cloud Logging ensures strong security with IAM-based access control, data encryption by default, audit logs, and compliance certifications like ISO, SOC, PCI, and HIPAA.
AWS CloudWatch also provides robust security with IAM policies, encryption, cross-account log sharing, and compliance support, making both platforms suitable for regulated and enterprise environments.
Both platforms are enterprise-grade:
- Encryption at rest & in transit
- IAM-based access
- SOC, ISO, HIPAA, PCI compliance
Proprietary Edge:
- GCP allows VPC Service Controls for data boundary security
- AWS integrates with GuardDuty, IAM Access Analyzer, and Security Hub
9. Integrations & Ecosystem
Google Cloud Logging integrates seamlessly with BigQuery, Pub/Sub, Cloud Monitoring, GKE, and third-party SIEM tools for smooth analytics and automation.
AWS CloudWatch connects with services like Lambda, Kinesis, S3, EKS, and numerous partner tools, offering a broad but more modular ecosystem for observability and event-driven workflows.
Google Cloud Logging Integrations
- BigQuery
- Dataflow
- Pub/Sub
- Chronicle SIEM
- GKE
- Grafana
AWS CloudWatch Integrations
- AWS Lambda
- S3
- Kinesis
- EventBridge
- SNS
- EKS
CloudWatch wins when the entire stack is AWS.
10. Developer Experience & UI Comparison
Google Cloud Logging offers a cleaner, unified interface with intuitive navigation, simple query tools, and easy log routing, giving developers a smooth and fast experience.
AWS CloudWatch provides powerful features but uses a more fragmented UI with separate sections for logs, metrics, alarms, and events, leading to greater flexibility but a steeper learning curve.
Google Cloud Logging UI
- Clean
- Fast
- Easy filtering
- Modern experience
CloudWatch UI
- Functional
- Highly granular
- Can be cluttered due to many components
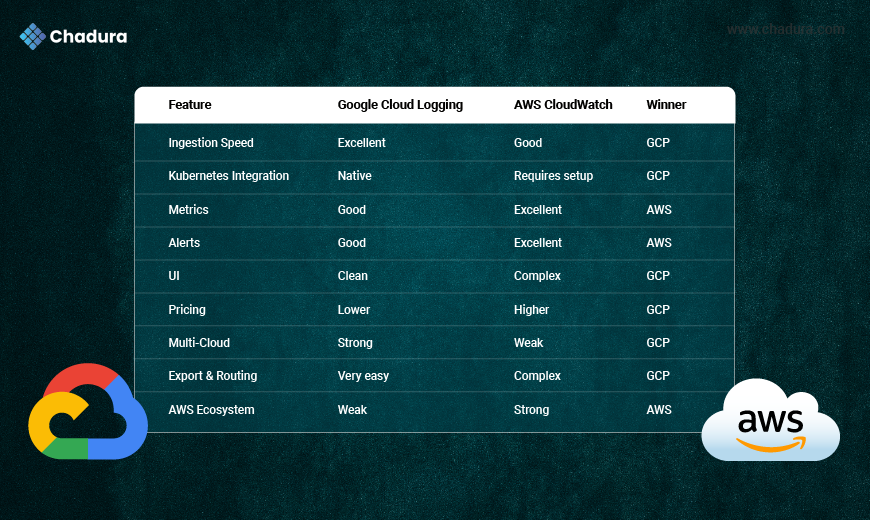
11.Features
Chadura Tech Perspective
At Chadura Tech, we work extensively with both GCP and AWS for cloud deployments, enterprise applications, distributed systems, and cloud-native workloads. Here is our opinion based on real-world client projects:
When Google Cloud Logging is the Better Choice
- You need real-time logs with low latency
- You operate large-scale GKE clusters
- You want simple log routing to BigQuery
- You require multi-cloud log collection
- You want cost-efficient logging
When AWS CloudWatch is the Better Choice
- Your environment is entirely AWS
- You rely heavily on metrics + alarms
- You need deeper integration with AWS services
- You want event-driven automation using EventBridge
Our Recommendation for Multi-Cloud Clients
Use Google Cloud Logging as the centralized aggregation layer and forward AWS logs using agents. This provides:
- Cheaper storage
- Better querying
- Simpler exports
- Unified dashboards
Final Verdict
Both platforms are outstanding—but built for different operational philosophies.
Choose Google Cloud Logging if:
✔ You want fast, scalable, low-cost logging
✔ You use Kubernetes heavily
✔ You need unified multi-cloud logging
✔ You want SQL-like log queries
✔ You want simple routing to BigQuery or Cloud Storage
Choose AWS CloudWatch if:
✔ You run fully on AWS
✔ You depend on CloudWatch Metrics + Alarms
✔ You want deep AWS ecosystem integrations
✔ You use EventBridge for automation
Conclusion
Google Cloud Logging and AWS CloudWatch each provide powerful observability capabilities. Google leads in real-time ingestion, cost efficiency, simplicity, and multi-cloud flexibility. AWS leads in monitoring depth, event automation, and deep ecosystem alignment.
For enterprises and growing tech companies, the best choice depends on the cloud architecture, operational model, and compliance needs. At Chadura Tech, our cloud engineering team helps organizations choose and implement the right observability stack—whether running on GCP, AWS, or a hybrid multi-cloud ecosystem.